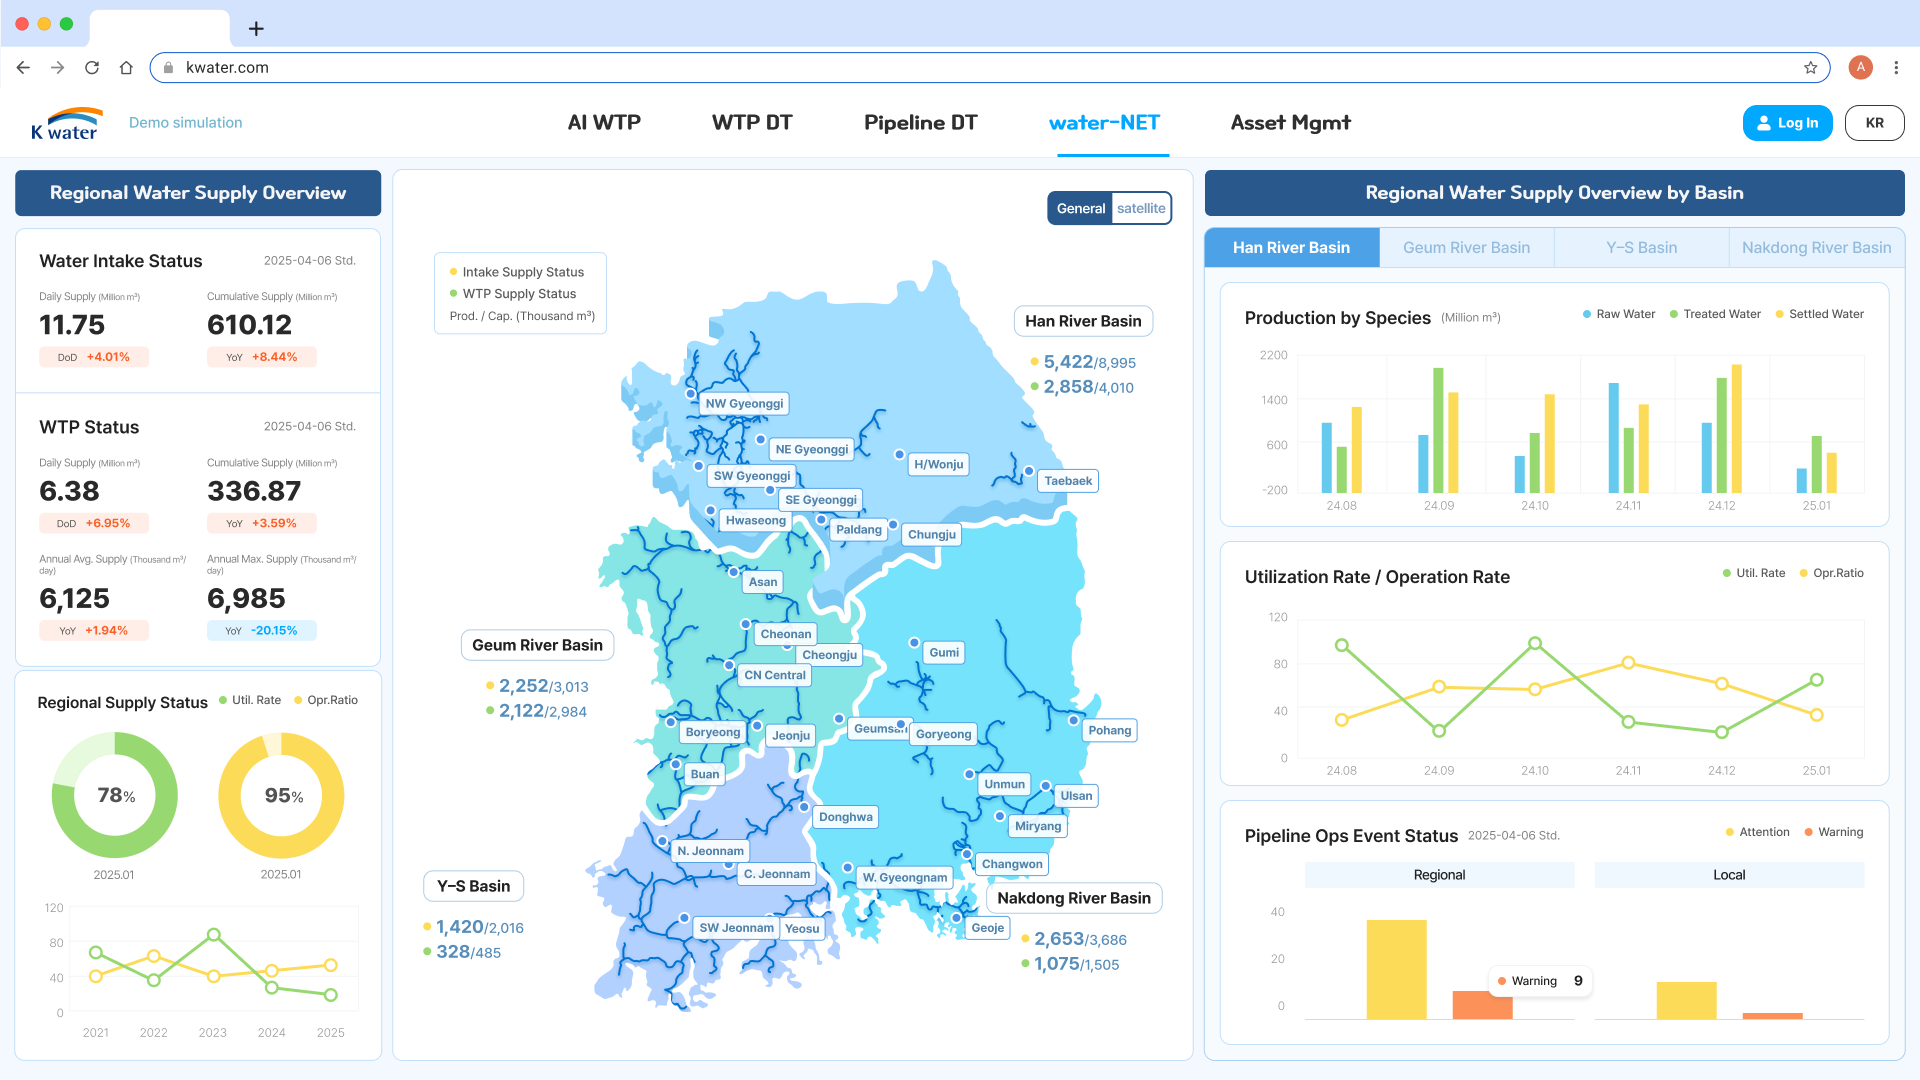
Integrates all water network information—such as production volume, supply volume, utilization rate, and operation rate—by site (treatment plant, intake station, etc.) and by water type (raw water, treated water, sedimentation water, etc.), allowing users to grasp the overall status at a glance.
Core Function 2
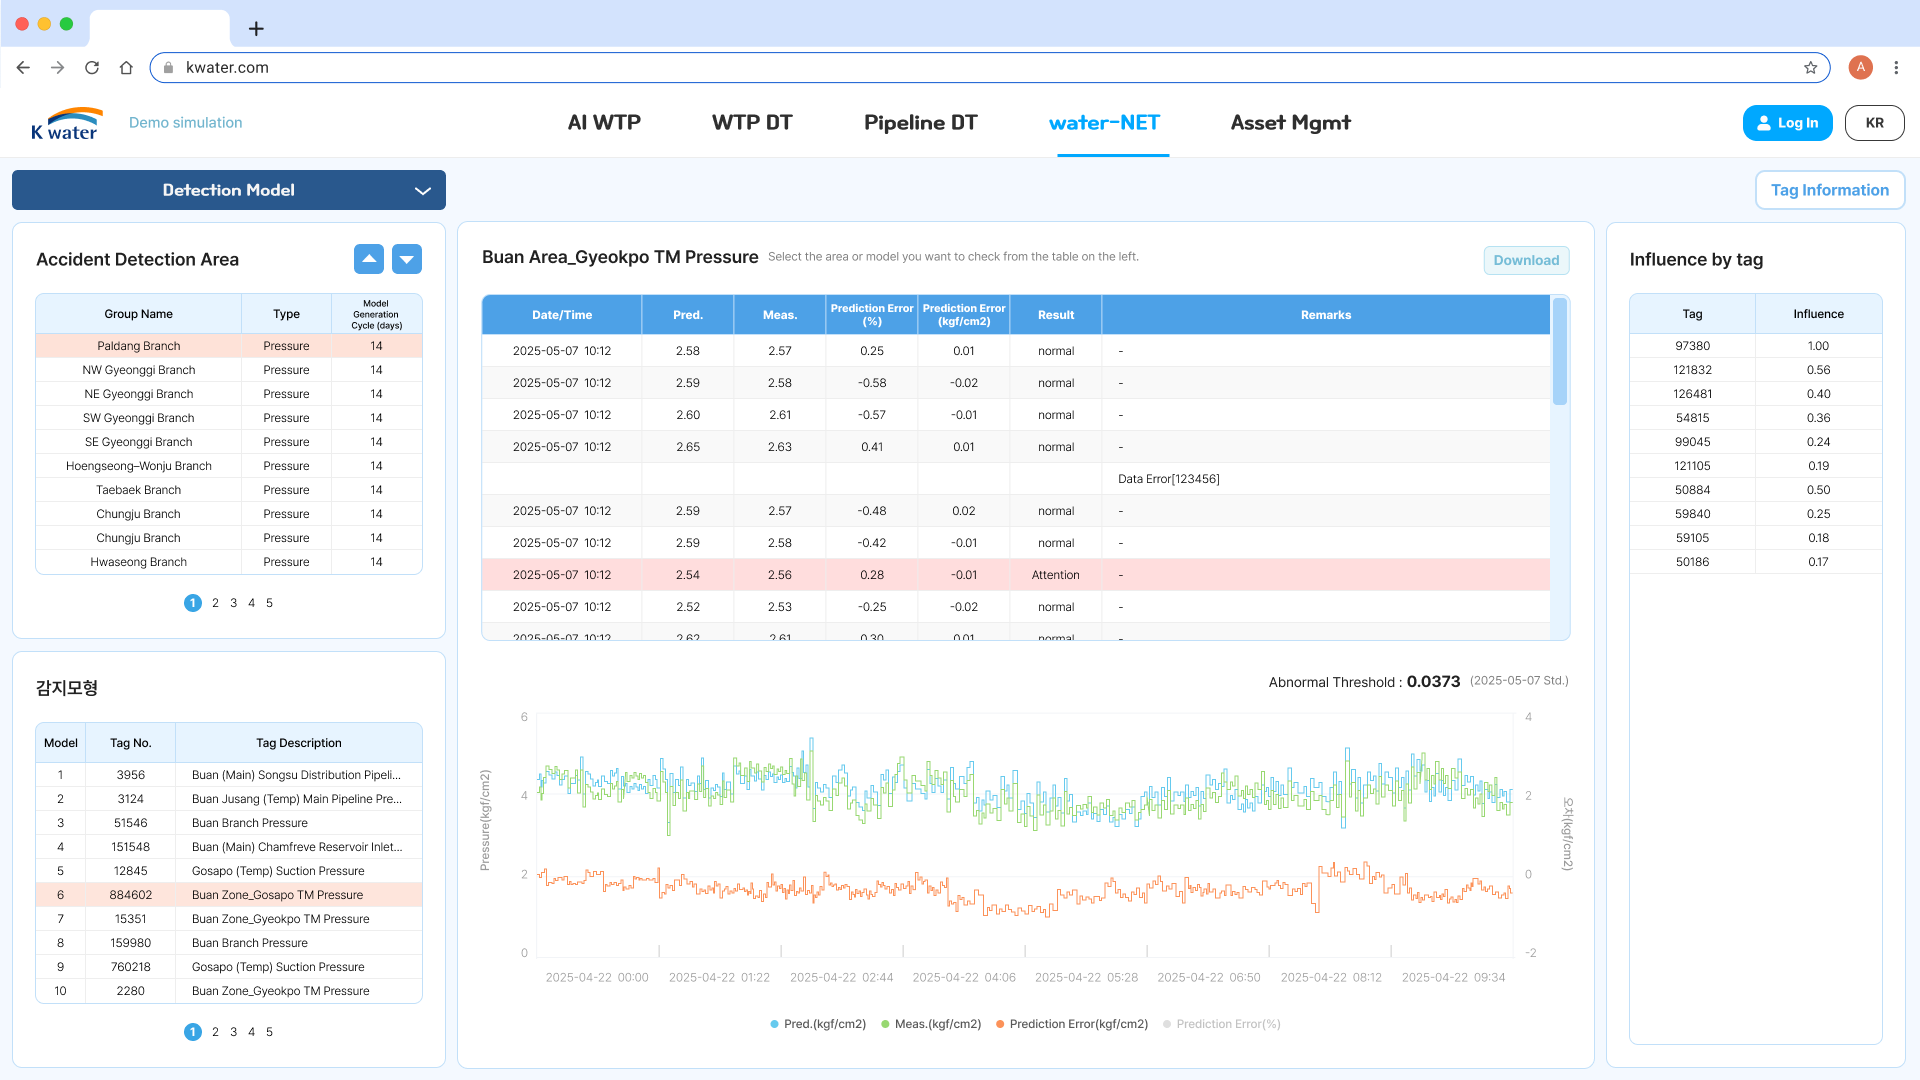
AI Anomaly Detection
Based on monitoring data from water facilities at each site (such as pumps, pressure gauges, and water level sensors), the system generates and analyzes AI incident detection models to monitor pipeline conditions in real time. This enables the detection of water supply incidents immediately upon occurrence—before they are reported externally—allowing for rapid, proactive responses and enhanced operational stability.
Core Function 3
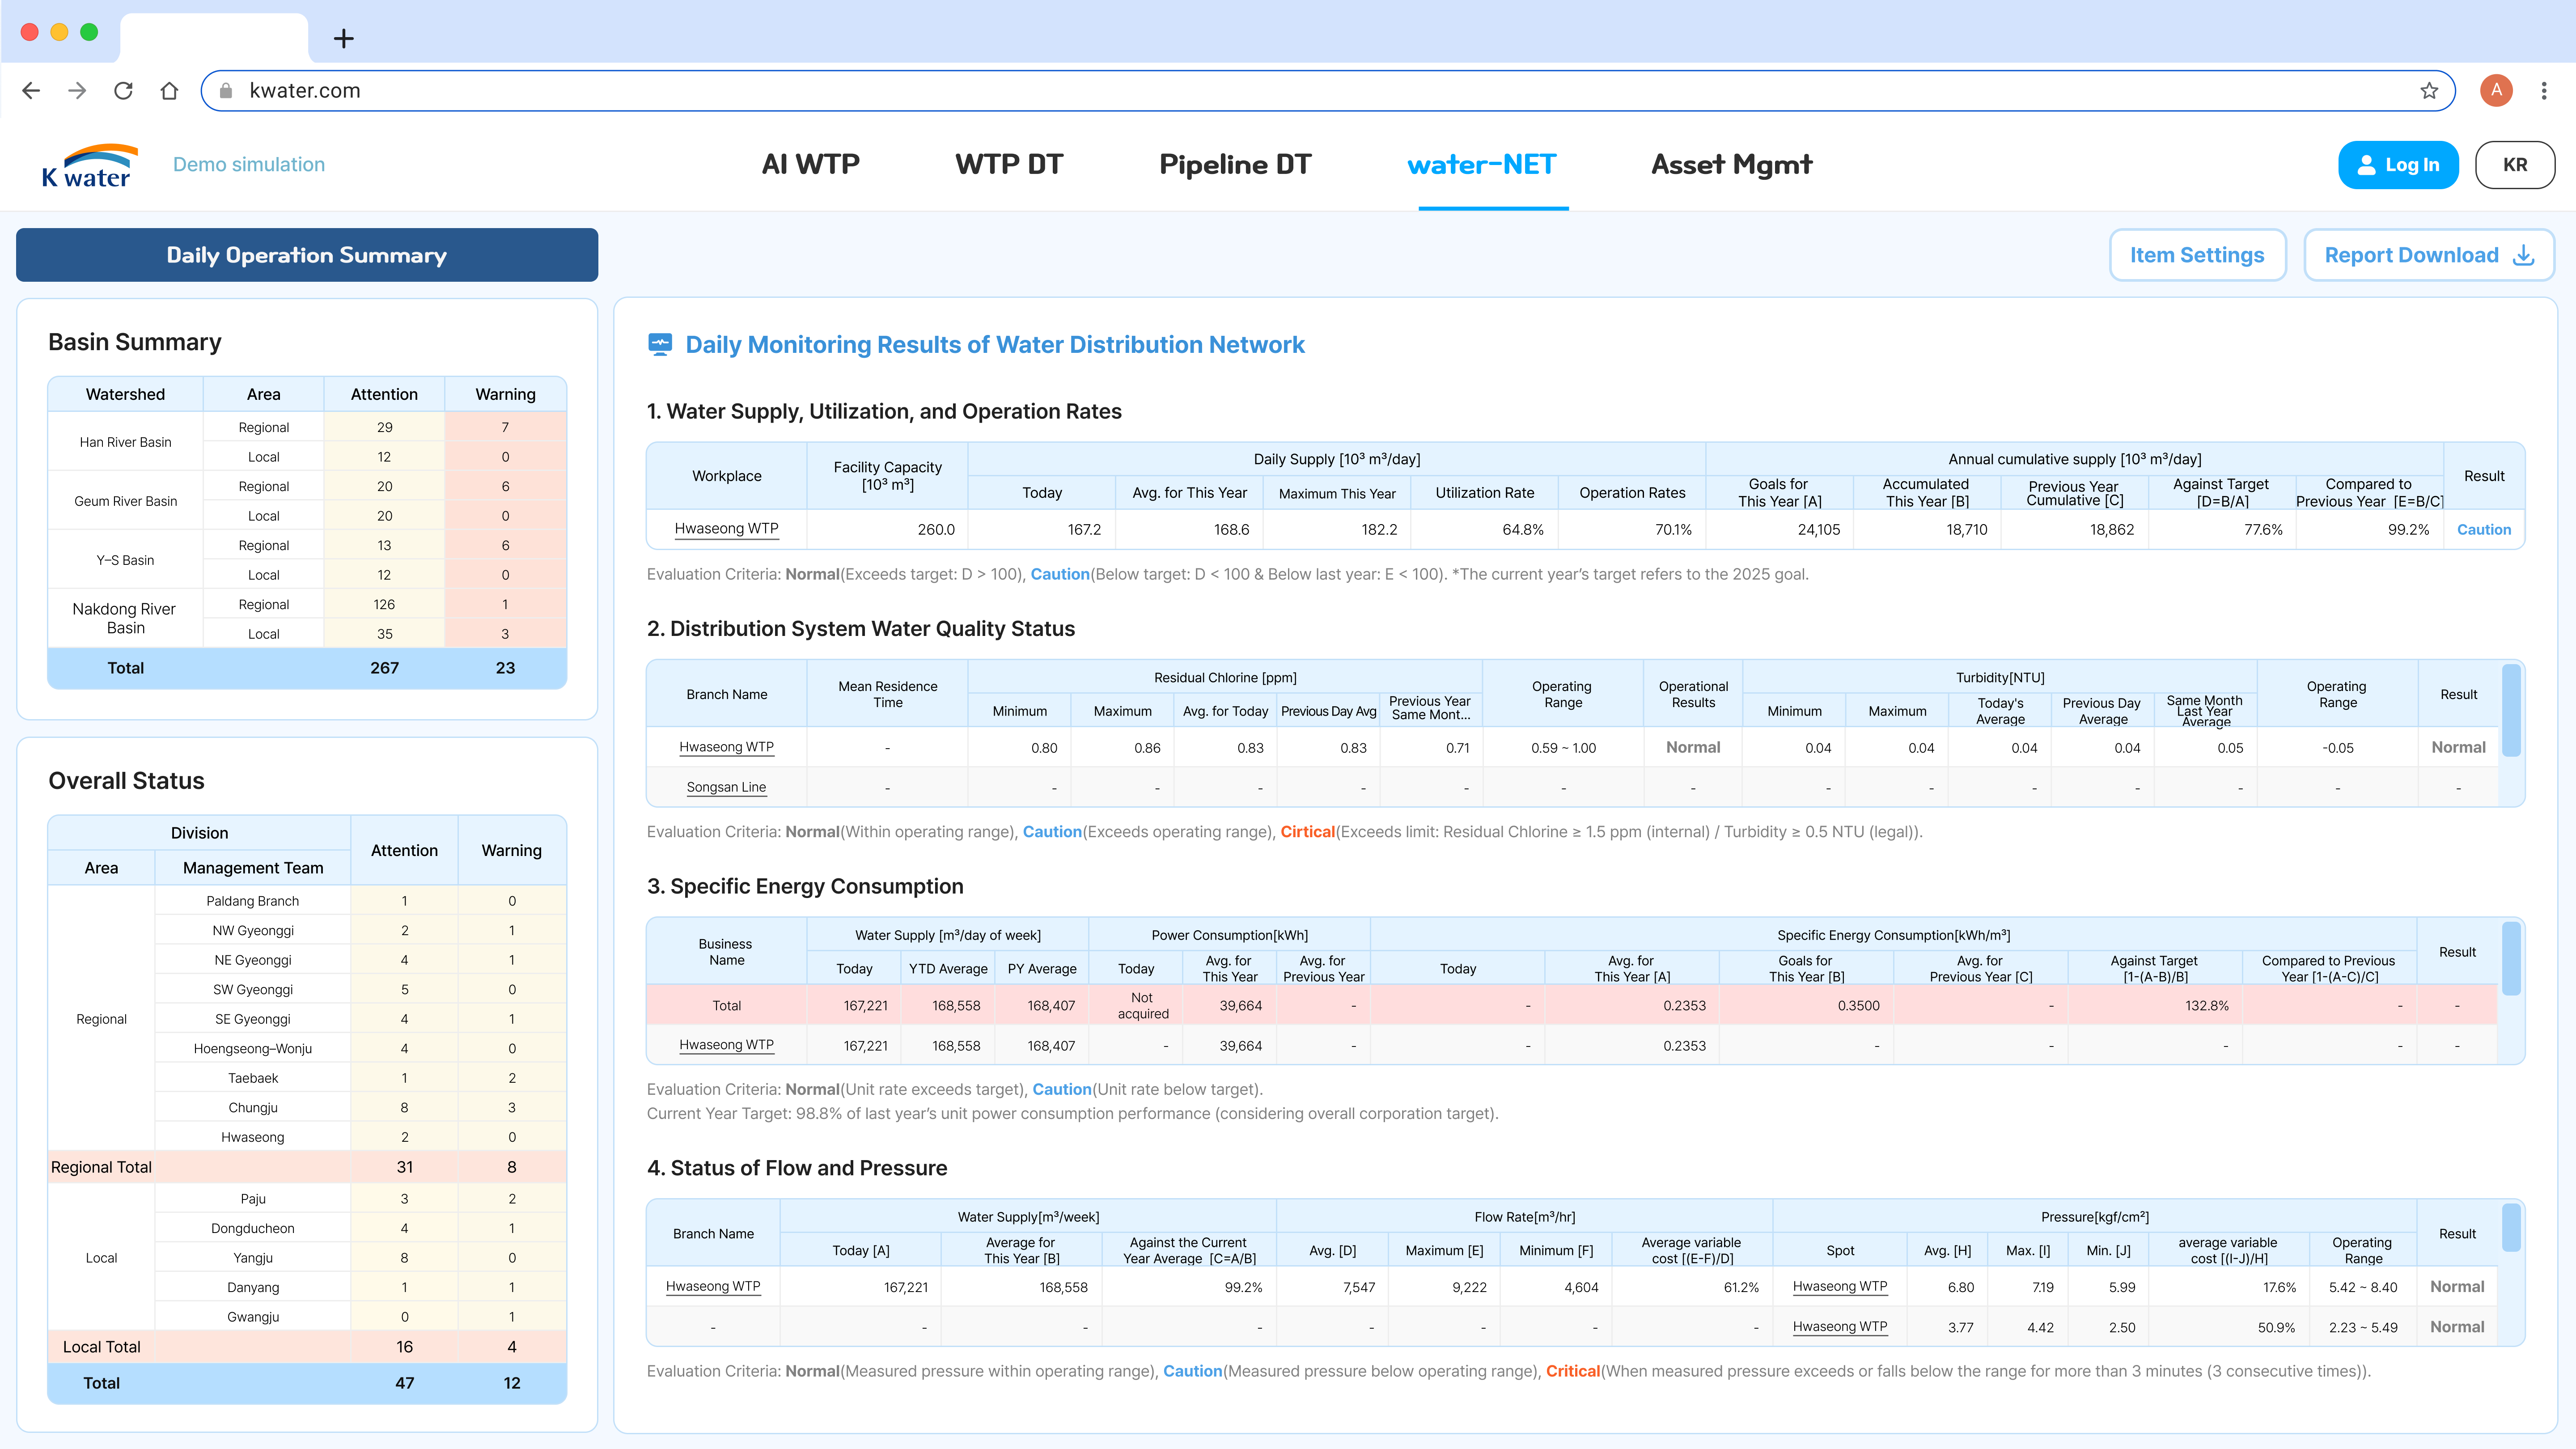
Pipeline Operation Daily Report
Displays daily monitoring reports for pipeline operations—including supply volume, water quality, energy consumption per unit, flow rate, and pressure—by site. Each management item is classified as Normal, Caution, or Alert according to predefined criteria, enabling quick and accurate analysis.
Core Function 4
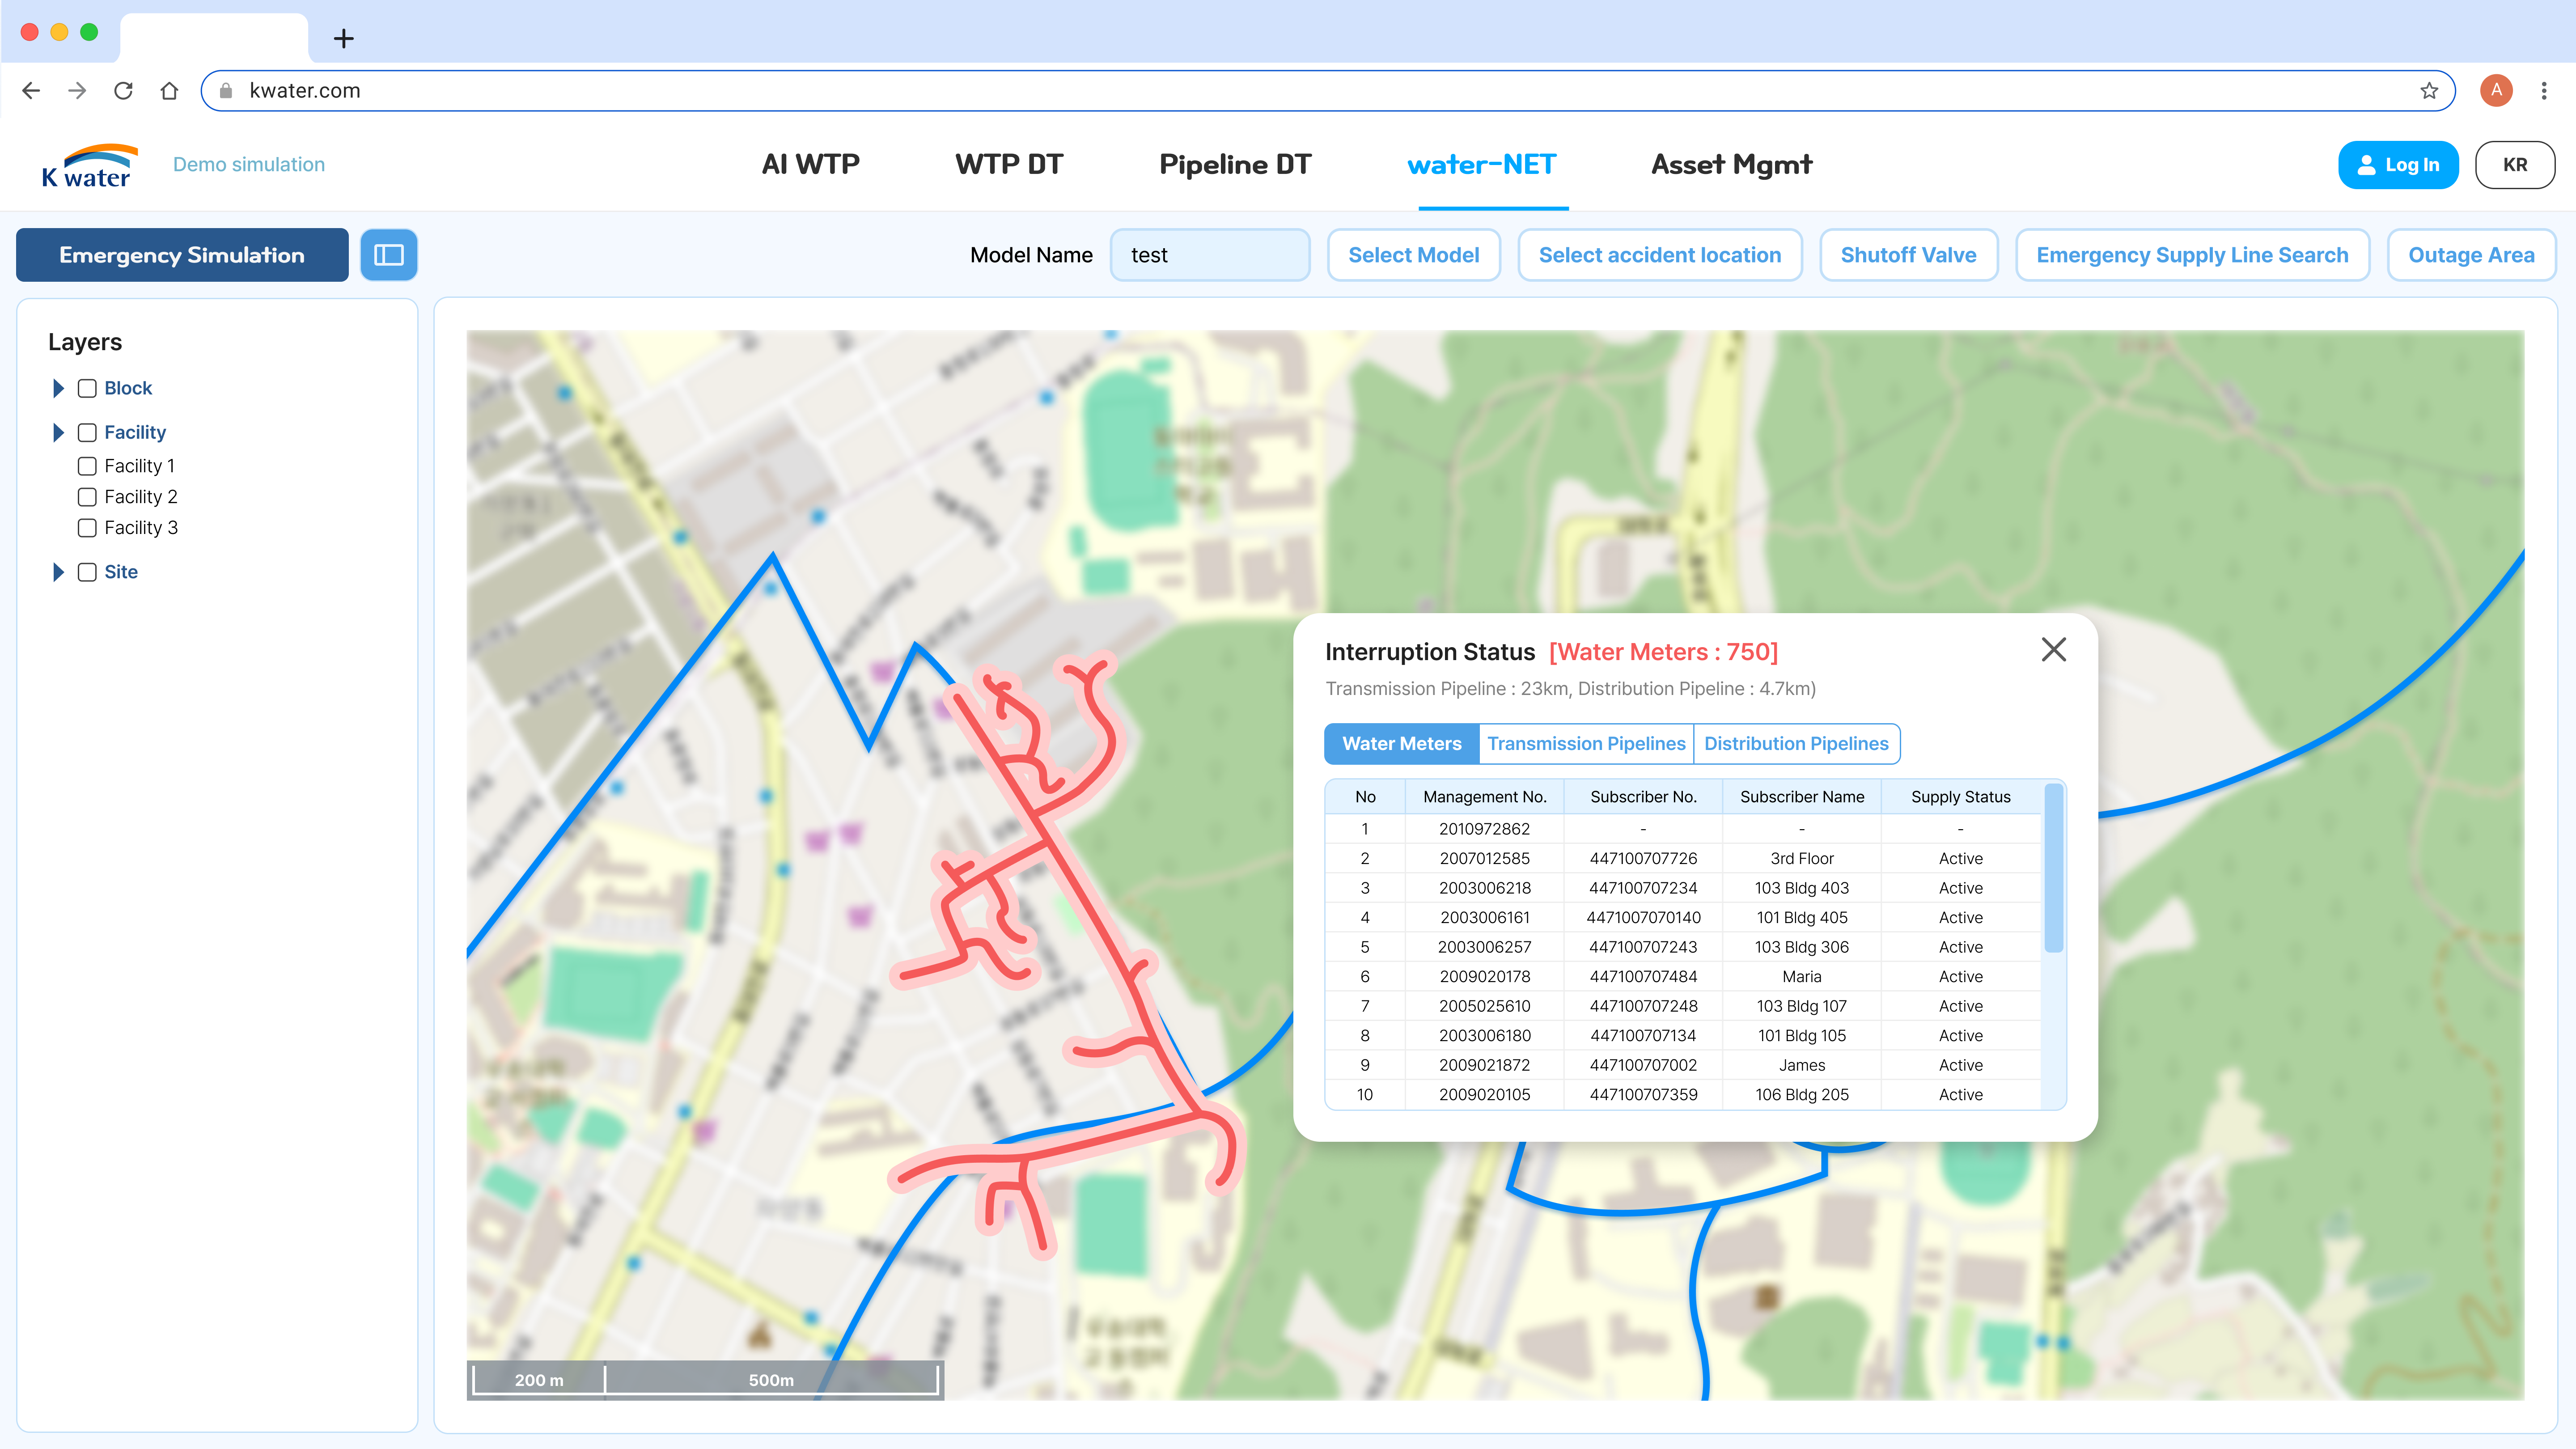
Online Pipeline Analysis
Allows real-time monitoring and analysis of flow and pressure in water mains. In the event of an incident, it performs crisis simulations to quickly identify the locations of shut-off valves and determine the affected outage area.
Core Function 5
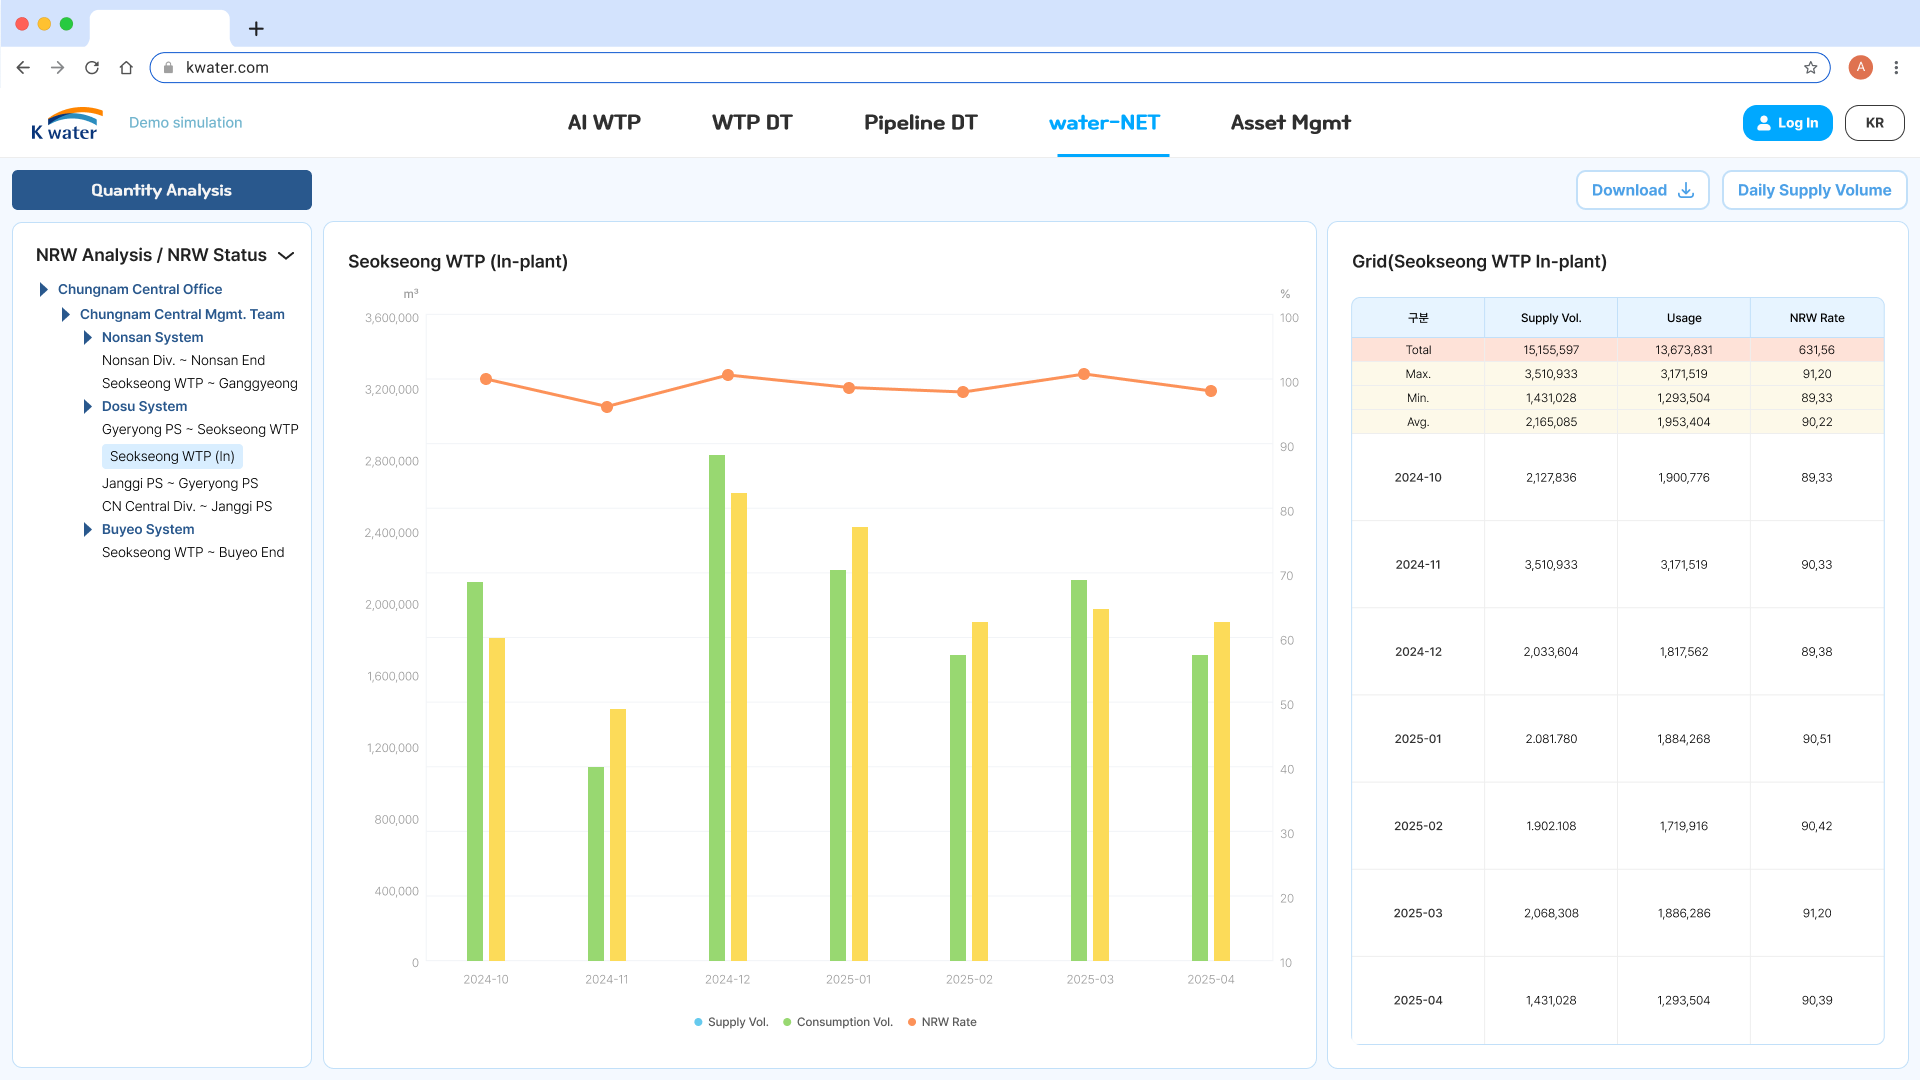
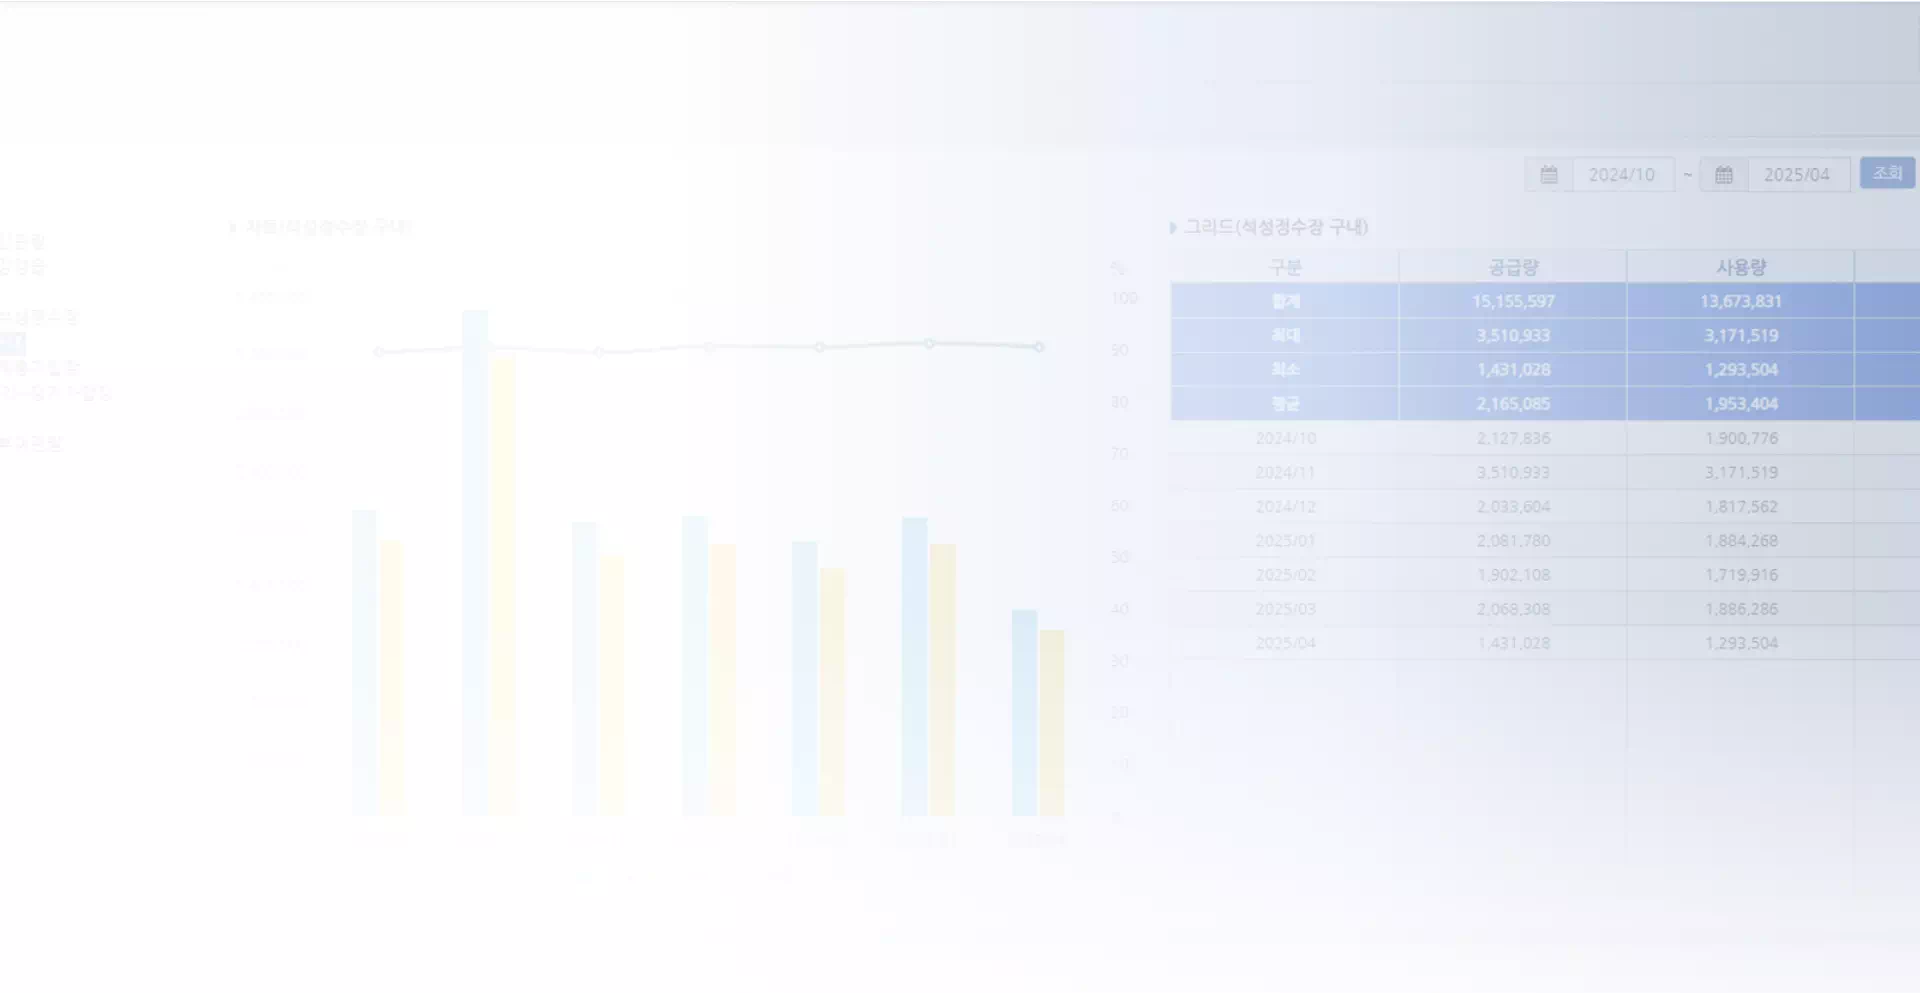
Data Analysis
Visually analyzes and tracks trends in flow rate, water quality, and pressure data collected in real time.